> For the complete documentation index, see [llms.txt](https://wiki.astrawireless.net/astra-wireless-documentation/llms.txt). Markdown versions of documentation pages are available by appending `.md` to page URLs; this page is available as [Markdown](https://wiki.astrawireless.net/astra-wireless-documentation/technical-documentation/astramux-switches/operation-and-administration/device-status.md).

# Device Status⁣

he "Device Status" page is displayed by default after the authentication step. It displays the main parameters of the unit in real-time.

<figure><img src="https://2734851754-files.gitbook.io/~/files/v0/b/gitbook-x-prod.appspot.com/o/spaces%2FnG7V17JtC1mMJOmveKc6%2Fuploads%2F7X0H04aHKxJ08vqJGLNm%2Fimage.png?alt=media&amp;token=52e9913d-b492-4e66-a027-7bc077d94fdd" alt=""><figcaption></figcaption></figure>

You can set the "Auto Refresh" option to refresh the statistics automatically. Refresh frequency can be set by the "Auto Refresh Time" parameter. The minimal possible value is “0” seconds and it updates the information instantly. These options are available in the bottom-left side of the "Device Status" screen. The device statistics can also be refreshed manually by clicking the «Refresh» button.

The "Device Status" page has the following sections: &#x20;

* "CPU load" - displays the load percentage of the CPU
* "Memory load":
  * Memory (the data stored in volatile memory are valid only during the current session, until the system reset) displays in real-time the total memory available and the used memory by the running processes.
  * Flash memory (non-volatile memory) displays in real-time the total memory available and the used memory by the WANFleX and configuration files.
* "Interface Statistics" - displays the main parameters of all configured interfaces (physical and logical)
* "Switch Statistics" - displays counters of the frames which have been switched or dropped.

### Interface Statistics <a href="#devicestatus-interfacestatistics" id="devicestatus-interfacestatistics"></a>

The software version is displayed in the right side of Interface Statistics section. Following parameters are displayed in the "Interface Statistics" section:

<table><thead><tr><th width="167">Parameter</th><th>Description</th></tr></thead><tbody><tr><td><strong>Status</strong></td><td><ul><li>Displays for each interface whether it is “up and running” or not</li></ul></td></tr><tr><td><strong>Packets</strong></td><td><ul><li>Displays the number of received and transmitted packets for each interface since the unit is operational. The local system packets are counted, too (and not only the ones that are passing through the switching groups - data traffic)</li></ul></td></tr><tr><td><strong>Mode</strong></td><td><ul><li><p>Displays the operation mode of each interface. For example:</p><ul><li>10,100 or 1000 Mbps and half or full duplex for the Ethernet interface</li><li>Switch Group number for the SVI</li></ul></li></ul></td></tr><tr><td><strong>MAC Address</strong></td><td><ul><li>Displays the MAC address of each interface</li></ul></td></tr><tr><td><strong>Load</strong></td><td><ul><li>Displays the packet flow through each interface in real-time (for the system and the data traffic)</li></ul></td></tr><tr><td><strong>Interface</strong></td><td><ul><li>Displays all physical and logical set interfaces </li></ul></td></tr><tr><td><strong>Errors</strong></td><td><ul><li>Displays the number of received and transmitted error packets for each interface since the unit is operational</li></ul></td></tr></tbody></table>

All these counters can be reset by clicking the "Reset All Counters" button.

{% hint style="danger" %}
**CAUTION**\
Clearing these counters by clicking the "OK" button in the pop-up page means losing the history data about the functionality of your unit. Avoid this operation unless you are completely sure you don’t need these data in the future. If you are not sure you want to permanently delete all statistics of the device for previous periods without the possibility to recover, click the "Cancel" button.
{% endhint %}

### Switch Statistics <a href="#devicestatus-switchstatistics" id="devicestatus-switchstatistics"></a>

This section displays the number of detected MAC addresses, unicast, broadcast and flood packets switched within each Switch group and also within kernel system (internal traffic), in real-time (since the last reboot). In addition, this section displays in real time statistics on dropped packets from the last configuration update. Total forwarded, dropped, ignored and buffer overflow packets are displayed in real-time below the table.

<table><thead><tr><th width="162">Parameter</th><th>Description</th></tr></thead><tbody><tr><td><strong>ID</strong></td><td><ul><li>The ID of a switch group or Kernel</li></ul></td></tr><tr><td><strong>MAC Count</strong></td><td><ul><li>The MAC addresses number involved in data transmission within this switch group</li></ul></td></tr><tr><td><strong>Unicast</strong></td><td><ul><li>Sending a packet to a single host (network destination) identified by a unique address</li></ul></td></tr><tr><td><strong>Broadcast</strong></td><td><ul><li>Sending a packet to all hosts (network destinations) simultaneously (broadcasting is done by specifying a special broadcast address on packets)</li></ul></td></tr><tr><td><strong>Flood</strong></td><td><ul><li>Sending a packet along the same link multiple times (without specifying a destination address for the packets)</li><li>Several copies of the same packet would ultimately reach all nodes in the network in flooding</li></ul></td></tr><tr><td><strong>STP</strong></td><td><ul><li>Spanning Tree Protocol - standardized as IEEE 802.1D</li><li>Creates a spanning tree within a network of connected layer-2 bridges (typically Ethernet switches) and disables those links that are not part of the spanning tree, leaving a single active path between any two network nodes</li><li>The value displayed in the Switch Statistics table represents the number of the packets blocked by the Spanning Tree Protocol</li></ul></td></tr><tr><td><strong>Unreachable</strong></td><td><ul><li>The sender could not reach the specified network destination</li><li>The value displayed in the Switch Statistics table represents the number of the packets dropped because they flood to unreachable destination</li></ul></td></tr><tr><td><strong>Firewall</strong></td><td><ul><li>A software or hardware-based network security system that controls the incoming and outgoing network traffic by analyzing the data packets and determining whether they should be allowed through or not, based on applied rules set</li><li>The value displayed in the Switch Statistics table represents the number of the packets dropped by the firewall system in the network</li></ul></td></tr><tr><td><strong>Possible loop</strong></td><td><ul><li>A switching or bridging loop occurs in a network when there is more than one Layer 2 path between two endpoints</li><li>Because a physical topology that contains switching or bridging loops is needed for the redundancy reasons, the solution is to allow physical loops, but create a loop-free logical topology using the spanning tree protocol (STP) on the network switches</li><li>The value displayed in the Switch Statistics table represents the number of the packets dropped because they belong to a possible loop (more than one port declares same packet source)</li></ul></td></tr><tr><td><strong>Discard</strong></td><td><ul><li>The value displayed in the Switch Statistics table represents the number of the packets dropped by the configuration (for example: "switch group N start [discard]")</li></ul></td></tr><tr><td><strong>MAC Limit</strong></td><td><ul><li>MAC address-table limit reached (switch maxsources (MAXSOURCES|0) # default 5000)</li><li>The value displayed in the Switch Statistics table represents the number of the packets dropped because the limit of MAC address-table was reached</li></ul></td></tr><tr><td><strong>Reverse</strong></td><td><ul><li>The value displayed in the Switch Statistics table represents the number of the packets dropped because they have the same source and destination port (the frame came to the unit through one port and according to the switching table it must leave through the same port</li></ul></td></tr></tbody></table>

### System Log <a href="#devicestatus-systemlog" id="devicestatus-systemlog"></a>

By clicking the "System Log" button, you can view the "System Log" section.

<figure><img src="https://2734851754-files.gitbook.io/~/files/v0/b/gitbook-x-prod.appspot.com/o/spaces%2FnG7V17JtC1mMJOmveKc6%2Fuploads%2F4k5Xruw0CemVDzO1Ifo4%2Fimage.png?alt=media&amp;token=a52b6292-5438-4590-9511-89a1cd1b5bdb" alt=""><figcaption></figcaption></figure>

The "System Log" section allows browsing the unit’s system log. It is possible to minimize/enlarge the system log window by clicking the buttons: ![](https://wiki.infinetwireless.com/download/attachments/94078360/minimize%20system%20window.jpg?version=1\&modificationDate=1615546802000\&api=v2). You can delete all the information saved in the system log by clicking the "Clear System Log" button. You can hide the System Log section by clicking the "Hide System Log" button.

## Extended Interface Statistics <a href="#devicestatus-extendedinterfacestatistics" id="devicestatus-extendedinterfacestatistics"></a>

The Extended Interface Statistics tools gather complete information and enhanced statistics for each interface of the unit.

In order to access the Extended Interface Statistics tools, click on the row of each interface within the "Interface Statistics" section.

<figure><img src="https://2734851754-files.gitbook.io/~/files/v0/b/gitbook-x-prod.appspot.com/o/spaces%2FnG7V17JtC1mMJOmveKc6%2Fuploads%2FLtICW7jh8LIE6xC7I9NI%2Fimage.png?alt=media&amp;token=da1a8425-ecc3-4ad4-93a3-f8e2db372647" alt=""><figcaption></figcaption></figure>

### General Statistics <a href="#devicestatus-generalstatistics" id="devicestatus-generalstatistics"></a>

The "General Statistics" tool displays the information about the interface such as the operational mode, current status, load statistics, Rx and Tx statistics, etc.

Statistic for the Ethernet interface.

<figure><img src="https://2734851754-files.gitbook.io/~/files/v0/b/gitbook-x-prod.appspot.com/o/spaces%2FnG7V17JtC1mMJOmveKc6%2Fuploads%2FBq9hOHUVK23cEJQRUP88%2Fimage.png?alt=media&amp;token=e4e96bad-c6f5-48c0-b5f3-f6c4733b81df" alt=""><figcaption></figcaption></figure>

| Parameter               | Description                                                                                            |
| ----------------------- | ------------------------------------------------------------------------------------------------------ |
| **Receive statistics**  |                                                                                                        |
| Packets                 | The total number of received packets                                                                   |
| Bytes                   | The sum of lengths of all good Ethernet frames received                                                |
| Load (kbps)             | The link load, Kbit/s                                                                                  |
| Load (pps)              | The link load, packets per second                                                                      |
| Frame size (bytes)      | The frame size in bytes                                                                                |
| CRC errors              | Total frames received with a CRC error                                                                 |
| Length errors           | Total abnormal length frames received                                                                  |
| Discards                | Number of dropped frames                                                                               |
| **Transmit statistics** |                                                                                                        |
| Packets                 | The total number of transmitted packets                                                                |
| Bytes                   | The sum of lengths of all good Ethernet frames sent                                                    |
| Load (kbps)             | The link load, Kbit/s                                                                                  |
| Load (pps)              | The link load, packets per second                                                                      |
| Frame size (bytes)      | The frame size in bytes                                                                                |
| Late collisions         | The number of times a collision is detected later than 512 bits-times into the transmission of a frame |
| Underrun                | The number of times the transmitter's packet processing rate exceeded the switch capabilities          |
| Retransmit limit        | Packets dropped due to queue overflow                                                                  |

For the pseudo-radio interface information about parent interface, MTU value and load statistics is available.

<figure><img src="https://2734851754-files.gitbook.io/~/files/v0/b/gitbook-x-prod.appspot.com/o/spaces%2FnG7V17JtC1mMJOmveKc6%2Fuploads%2FwwxRQuB4iHjBXErUYi4C%2Fimage.png?alt=media&amp;token=831ffaea-4fe9-4cde-ba44-bd29dbd028f2" alt=""><figcaption></figcaption></figure>

| Parameter                   | Description                                                                                                  |
| --------------------------- | ------------------------------------------------------------------------------------------------------------ |
| **Receive statistics**      |                                                                                                              |
| Packets                     | Number of correctly received packets                                                                         |
| Fragmented                  | Number of fragmented packets                                                                                 |
| Fragments                   | Number of fragments                                                                                          |
| Load (kbps)                 | The link load, Kbit/s                                                                                        |
| Load (pps)                  | The link load, packets per second                                                                            |
| Frame size (bytes)          | The frame size in bytes                                                                                      |
| Scattered fragments         | Number of frames where one or several fragments were lost, the frame cannot be restored                      |
| Corrupted packets           | Number of frames with the wrong length or structure                                                          |
| **Transmit statistics**     |                                                                                                              |
| Packets                     | Number of correctly transmitted packets                                                                      |
| Fragmented                  | Number of fragmented packets                                                                                 |
| Fragments                   | Number of fragments                                                                                          |
| Load (kbps)                 | The link load, Kbit/s                                                                                        |
| Load (pps)                  | The link load, packets per second                                                                            |
| Frame size (bytes)          | The frame size in bytes                                                                                      |
| Double encapsulated packets | Number of frames with double encapsulation                                                                   |
| Out of fragbufs             | Number of errors as a result of frame assembly buffer overflow due to too many fragments (neighbors) sources |

For the SVI interface information about current status, RX and TX staistics is available.

<figure><img src="https://2734851754-files.gitbook.io/~/files/v0/b/gitbook-x-prod.appspot.com/o/spaces%2FnG7V17JtC1mMJOmveKc6%2Fuploads%2FkeexhdEb6ACwvp61lwKf%2Fimage.png?alt=media&amp;token=1c381ee7-7a80-4abb-a75e-13a69e32c51b" alt=""><figcaption></figcaption></figure>

By clicking the "Close" button, you return to the "Device Status" page. By clicking the "Reset" button, you clear all counters displayed in the page. The "Auto Refresh" option is active by default and refreshes the statistics automatically. You can disable the auto refresh.

### QoS Statistics <a href="#devicestatus-qosstatistics" id="devicestatus-qosstatistics"></a>

QoS characterizes the entire network performance which is defined by the parameters such as: throughput, latency, jitter, error rate, available bandwidth, etc. In order to provide the guaranteed Quality of Service for certain applications, users or data flows, different prioritization methods are used. The "QoS Statistics" tool displays the statistics of the MINT priority queues for the interface. Priority is one of the parameters which define in what sequence, different types of data traversing every Astrawireless device in MINT network are treated. Each channel may be assigned a priority (for example: P01, P02 … P16). Once assigned, a priority is automatically recognized by every node inside the MINT network. Each priority value corresponds to a device queue. Once in a queue, every packet is scheduled according to the queuing algorithm set on the device. QM manager supports Strict Priority Queuing and Weighted Fair Queuing scheduling algorithms. Strict Priority Queuing means that the packets from queue with lower priority are not processed until the queue with higher priority is not empty. Weighted Fair Queuing uses weights for every queue of an interface and allows different queues to have different service shares, depending on that weight. Every channel is also characterized by the latency parameter. This parameter determines the maximum time for the packets to stay in the channel. If a packet is waiting in a queue of the channel more than the time specified in the latency parameter, then it is discarded. Latency can be set for each channel in the "Traffic Shaping⁣" section.

| Channel             | Priority |
| ------------------- | -------- |
| BACKGROUND          | 16       |
| REGULAR Best Effort | 15       |
| BUSINESS6           | 14       |
| BUSINESS5           | 13       |
| BUSINESS4           | 12       |
| BUSINESS3           | 11       |
| BUSINESS2           | 10       |
| BUSINESS1           | 9        |
| QOS4                | 8        |
| QOS3                | 7        |
| QOS2                | 6        |
| QOS1                | 5        |
| VIDEO2              | 4        |
| VIDEO               | 3        |
| VOICE               | 2        |
| CONTROL             | 1        |
| NETCRIT             | 0        |

**Table - MINT priorities**

Transparent packet prioritization is a WANFleX feature which allows QM manager to transparently map 802.1p/TOS/DSCP priority to MINT priority for the ease of deployment. You have to make sure that “Dot1p Tags” and/or “IP ToS” options are enabled in the "QoS" section.

<table><thead><tr><th>MINT priority</th><th width="160">Traffic types 802.1p</th><th width="92">802.1p</th><th width="89">IP ToS</th><th>DSCP name</th><th>DS Field value</th></tr></thead><tbody><tr><td>16 BACKGROUND</td><td>Background</td><td>1</td><td><br></td><td><br></td><td><br></td></tr><tr><td>15 REGULAR Best Effort</td><td>Best Effort</td><td>0</td><td>0</td><td>CS0</td><td>0</td></tr><tr><td>14 BUSINESS6</td><td><br></td><td><br></td><td>1</td><td>CS1, AF11-13</td><td>8, 10</td></tr><tr><td>13 BUSINESS5</td><td><br></td><td><br></td><td><br></td><td><br></td><td>12, 14</td></tr><tr><td>12 BUSINESS4</td><td><br></td><td><br></td><td>2</td><td>CS2, AF21-23</td><td>16, 18</td></tr><tr><td>11 BUSINESS3</td><td><br></td><td><br></td><td><br></td><td><br></td><td>20, 22</td></tr><tr><td>10 BUSINESS2</td><td><br></td><td><br></td><td>3</td><td>CS3, AF31-33</td><td>24, 26</td></tr><tr><td>9 BUSINESS1</td><td>Excellent Effort</td><td>2</td><td><br></td><td><br></td><td>28, 30</td></tr><tr><td>8 QOS4</td><td><br></td><td><br></td><td>4</td><td>CS4, AF41-43</td><td>32</td></tr><tr><td>7 QOS3</td><td><br></td><td><br></td><td><br></td><td><br></td><td>34</td></tr><tr><td>6 QOS2</td><td><br></td><td><br></td><td><br></td><td><br></td><td>36</td></tr><tr><td>5 QOS1</td><td>Critical Applications</td><td>3</td><td><br></td><td><br></td><td>38</td></tr><tr><td>4 VIDEO2</td><td>Video</td><td>4</td><td>5</td><td>CS5, EF</td><td>40, 42</td></tr><tr><td>3 VIDEO</td><td><br></td><td><br></td><td><br></td><td><br></td><td>44, 46</td></tr><tr><td>2 VOICE</td><td>Voice</td><td>5</td><td>6</td><td>CS6</td><td>48, 50</td></tr><tr><td>1 CONTROL</td><td>Internetwork Control</td><td>6</td><td><br></td><td><br></td><td>52, 54</td></tr><tr><td>0 NETCRIT</td><td>Network Control</td><td>7</td><td>7</td><td>CS7</td><td>56, 58, 60, 62</td></tr></tbody></table>

This section displays the number of inbound packets to each priority queue and the number of dropped packets. Of the 32 priority queues 17 are available for user configuration (from P00 to P16), where 0 is the highest priority. The rest are reserved for the system. Packets with 802.1p priority are distributed to queues with "cosX" values.

<figure><img src="https://2734851754-files.gitbook.io/~/files/v0/b/gitbook-x-prod.appspot.com/o/spaces%2FnG7V17JtC1mMJOmveKc6%2Fuploads%2Fr0YWE8ksbYR1YsxSbPgq%2Fimage.png?alt=media&amp;token=f57705b1-5564-44bd-8543-07964c2653f9" alt=""><figcaption></figcaption></figure>

By clicking the "Close" button, you return to the "Device Status" page. By clicking the "Reset" button, you clear all counters displayed in the page. The "Auto Refresh" option is active by default and refreshes the statistics automatically. You can disable the auto refresh.

### Network Address Table <a href="#devicestatus-networkaddresstable" id="devicestatus-networkaddresstable"></a>

The "Network Address Table" tool shows the network address table for the interface.

<figure><img src="https://2734851754-files.gitbook.io/~/files/v0/b/gitbook-x-prod.appspot.com/o/spaces%2FnG7V17JtC1mMJOmveKc6%2Fuploads%2FnQJdnaDHWdoRVnPXVG3q%2Fimage.png?alt=media&amp;token=be9fd755-c1ef-48dc-a3e9-7eefd5c0680f" alt=""><figcaption></figcaption></figure>

By clicking the "Close" button, you return to the "Device Status" page. The "Auto Refresh" option is active by default and refreshes the statistics automatically. You can disable the auto refresh.

### LLDP Information <a href="#devicestatus-lldpinformation" id="devicestatus-lldpinformation"></a>

The "LLDP Information" tool allows to get information on the link layer discovery protocol.

<figure><img src="https://2734851754-files.gitbook.io/~/files/v0/b/gitbook-x-prod.appspot.com/o/spaces%2FnG7V17JtC1mMJOmveKc6%2Fuploads%2Fa5sAhWdsOHzPk5BElVhd%2Fimage.png?alt=media&amp;token=93a48b18-2964-4e12-b5d3-6fb54c201704" alt=""><figcaption></figcaption></figure>

By clicking the "Close" button, you return to the "Device Status" page. The "Auto Refresh" option is active by default and refreshes the statistics automatically. You can disable the auto refresh.

### Graphs <a href="#devicestatus-graphs" id="devicestatus-graphs"></a>

The "Graphs" tool allows you to monitor the device parameters represented in the graphical charts. The following modes are available: real-time monitoring, daily and monthly data logs display.

<figure><img src="https://2734851754-files.gitbook.io/~/files/v0/b/gitbook-x-prod.appspot.com/o/spaces%2FnG7V17JtC1mMJOmveKc6%2Fuploads%2FPfyKGGuTR8zT7UAvai0E%2Fimage.png?alt=media&amp;token=139c2de2-0cd2-4fe8-bbdb-cb7b1d50abd1" alt=""><figcaption></figcaption></figure>

### Extended Switch Statistics <a href="#devicestatus-extendedswitchstatistics" id="devicestatus-extendedswitchstatistics"></a>

The "Extended Switch Statistics" tools allow gathering complete information and enhanced statistics for each group of the unit.&#x20;

<figure><img src="https://2734851754-files.gitbook.io/~/files/v0/b/gitbook-x-prod.appspot.com/o/spaces%2FnG7V17JtC1mMJOmveKc6%2Fuploads%2FXFiJRrSoGUuQqzOVHt3Q%2Fimage.png?alt=media&amp;token=7011fb65-edd9-4380-88f7-8be9cef43622" alt=""><figcaption></figcaption></figure>

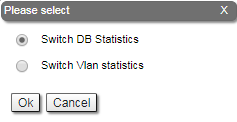
In order to access the "Extended Switch Statistics" tools, click on the row of each switch group or kernel within the "Switch Statistics" section.

<p align="center"><img src="https://wiki.infinetwireless.com/download/attachments/94078360/image2017-7-31_10-29-52.png?version=1&#x26;modificationDate=1615546802000&#x26;api=v2" alt=""></p>

Two options are available: "Switch DB statistics" and "Switch VLAN statistics".

**Switch DB Statistics**

The "Switch DB Statistics" tool gathers complete information and enhanced statistics for each switch group, including kernel.

<figure><img src="https://2734851754-files.gitbook.io/~/files/v0/b/gitbook-x-prod.appspot.com/o/spaces%2FnG7V17JtC1mMJOmveKc6%2Fuploads%2FgniUMvnm4SikbVAmCMaz%2Fimage.png?alt=media&amp;token=e2094f0e-e931-43e6-87b4-665b742f0a5d" alt=""><figcaption></figcaption></figure>

By clicking the "Close" button, you return to the "Device Status" page. The "Auto Refresh" option is disabled by default. You can enable the auto refresh in order to have the statistics automatically refreshed.

**Switch VLAN Statistics**

The "Switch VLAN Statistics" tool gathers complete information and enhanced statistics for each VLAN created.

<figure><img src="https://2734851754-files.gitbook.io/~/files/v0/b/gitbook-x-prod.appspot.com/o/spaces%2FnG7V17JtC1mMJOmveKc6%2Fuploads%2FNBtYdSgJT7eulvdHK2UW%2Fimage.png?alt=media&amp;token=a8e24cff-d6bb-4427-abf2-f9375eeeae3f" alt=""><figcaption></figcaption></figure>

By clicking the "Close" button, you return to the "Device Status" page. The "Auto Refresh" option is disabled by default. You can enable the auto refresh in order to have the statistics automatically refreshed.